Yellevate Business Analysis
This is a Refocus Project that involves team effort to evaluate a client's dissatisfaction with company services using tools such as SQL and Excel. By the end of the case study, the group provided a comprehensive visual report, along with recommended actions for resolution.
Summary
Yellevate, a marketing services company, has struggled with client disputes resulting in a 5% annual loss of revenue. The team of data analysts conducted statistical analysis and data visualization and found that Yellevate is losing more disputes in France than any other country, accounting for 76% of revenue lost in 2 years. The team recommended that Yellevate investigate and eliminate operational issues in the department that handles invoices and transactions in France, create a tracking system for customer rating and credit standing, and communicate with clients to identify reasons for disputes and complaints. Implementing these strategies can address the root causes of disputes, improve customer service, and ultimately increase revenue and customer satisfaction for Yellevate.

Background
The company Yellevate specializes in providing marketing services to other companies. Yellevate helps mid-sized companies to launch their marketing operations which includes things like email marketing, website development, content creation and others. Yellevate uses data analytics to keep track of how well it helps companies improve their marketing operations. For instance, if a company approaches Yellevate to help improve its online advertising operations, Yellevate tracks this by looking at email impressions, click-through rates, website traffic and other key performance indicators.
However, Yellevate has been facing a significant financial burden due to client disputes where nearly 20% of disputes have resulted in a payment opt-out, causing an estimated 5% annual loss of revenue. The management has assigned a team to analyze the data collected about these disputes and identify their root causes. The team is expected to develop actionable strategies to solve the issue.
Objectives
The team had access to a dataset containing information on customer disputes, including invoice numbers, dollar values, and the time it took to settle disputes. With this data, the group established team objectives for their analysis:
Methodology
Import
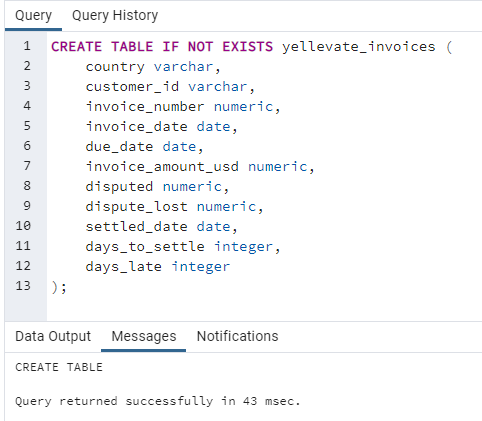
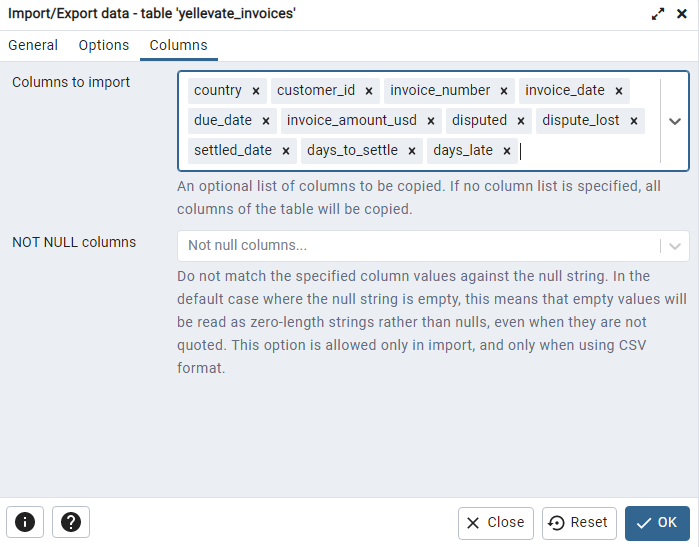
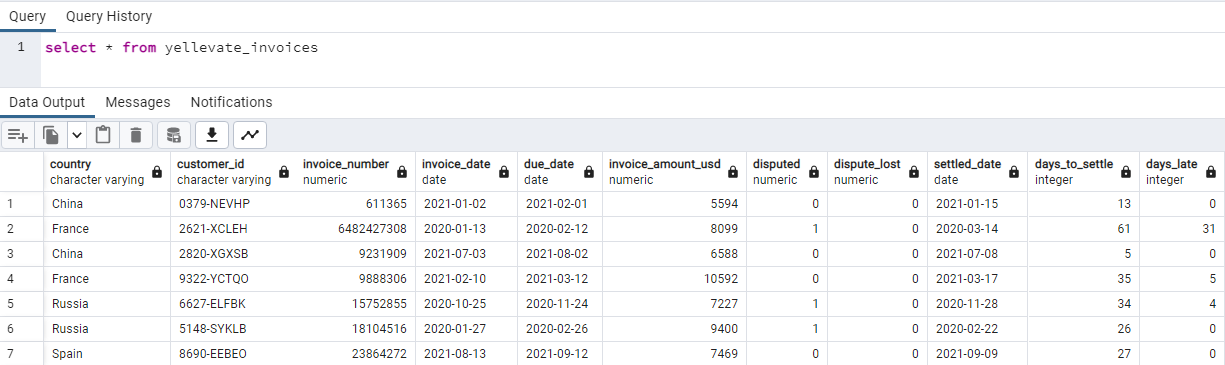
First step was to create a database in PgAdmin 4 using PostgreSqL and create a new table named "yellevate_invoices". Then the provided csv file was imported into pgadmin and into the table just created. Finally, a query was made to check the dataset.
Process
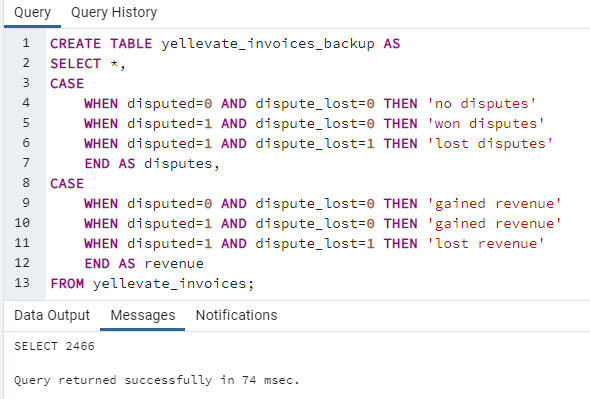
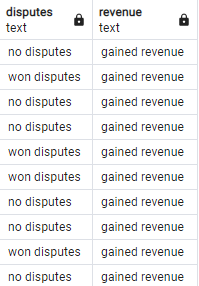
To prepare the dataset for Excel, a new table was created which will include two (2) new columns named: "disputes" and "revenue". This is to help in the process of creating data visualization in Excel.
Analyze
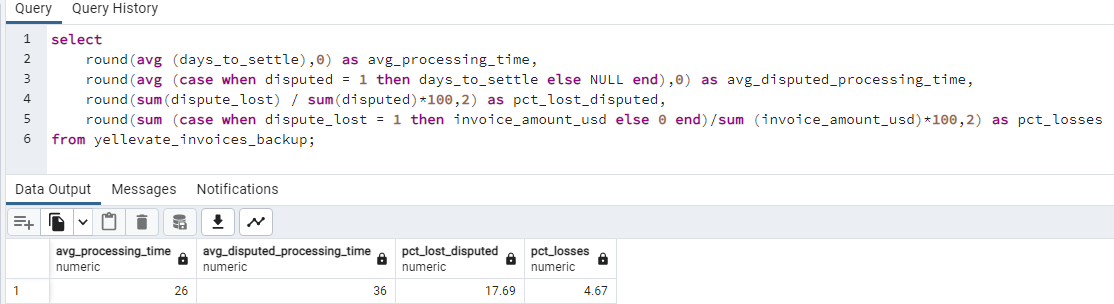
Before transferring our processed dataset to Excel, we initiate our data analysis by writing a subquery to answer all our questions related to our team objectives. Questions 1-4 were answered in one line of code while Question 5 was done separately. Afterwhich, the results were saved into a .csv file.
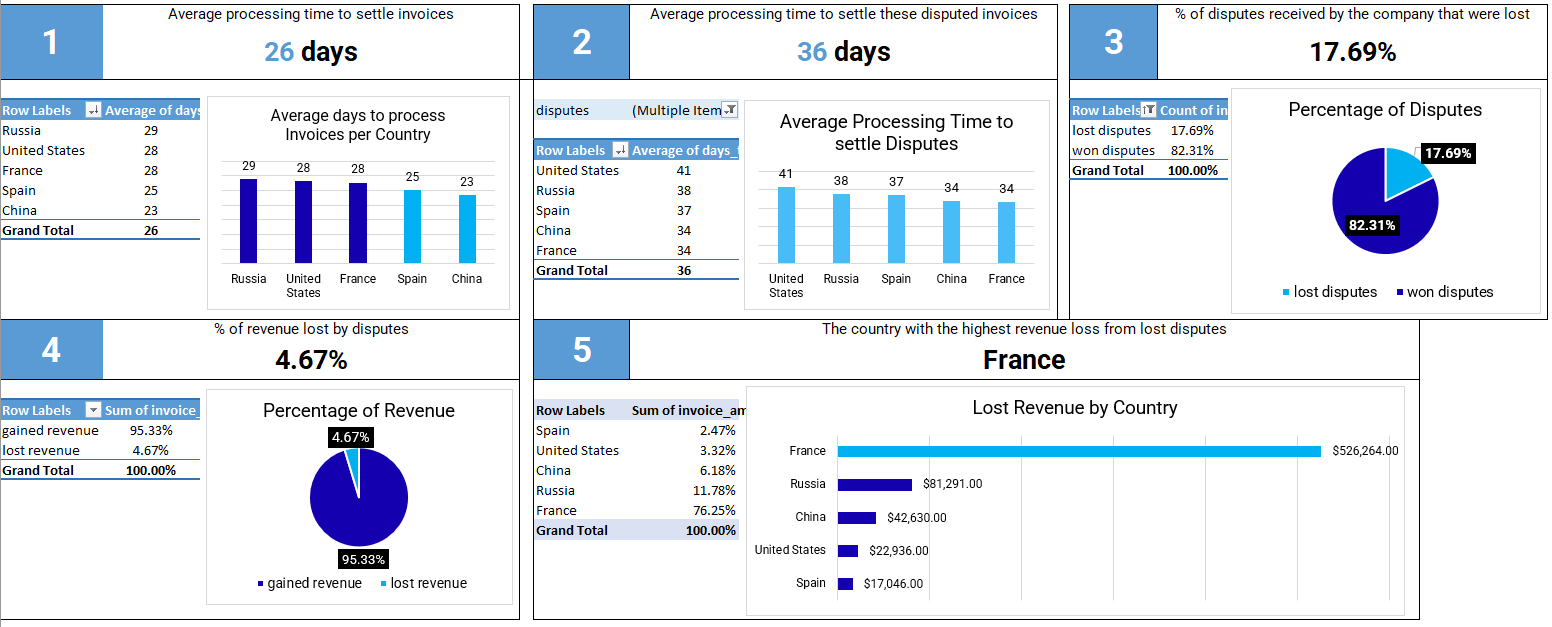
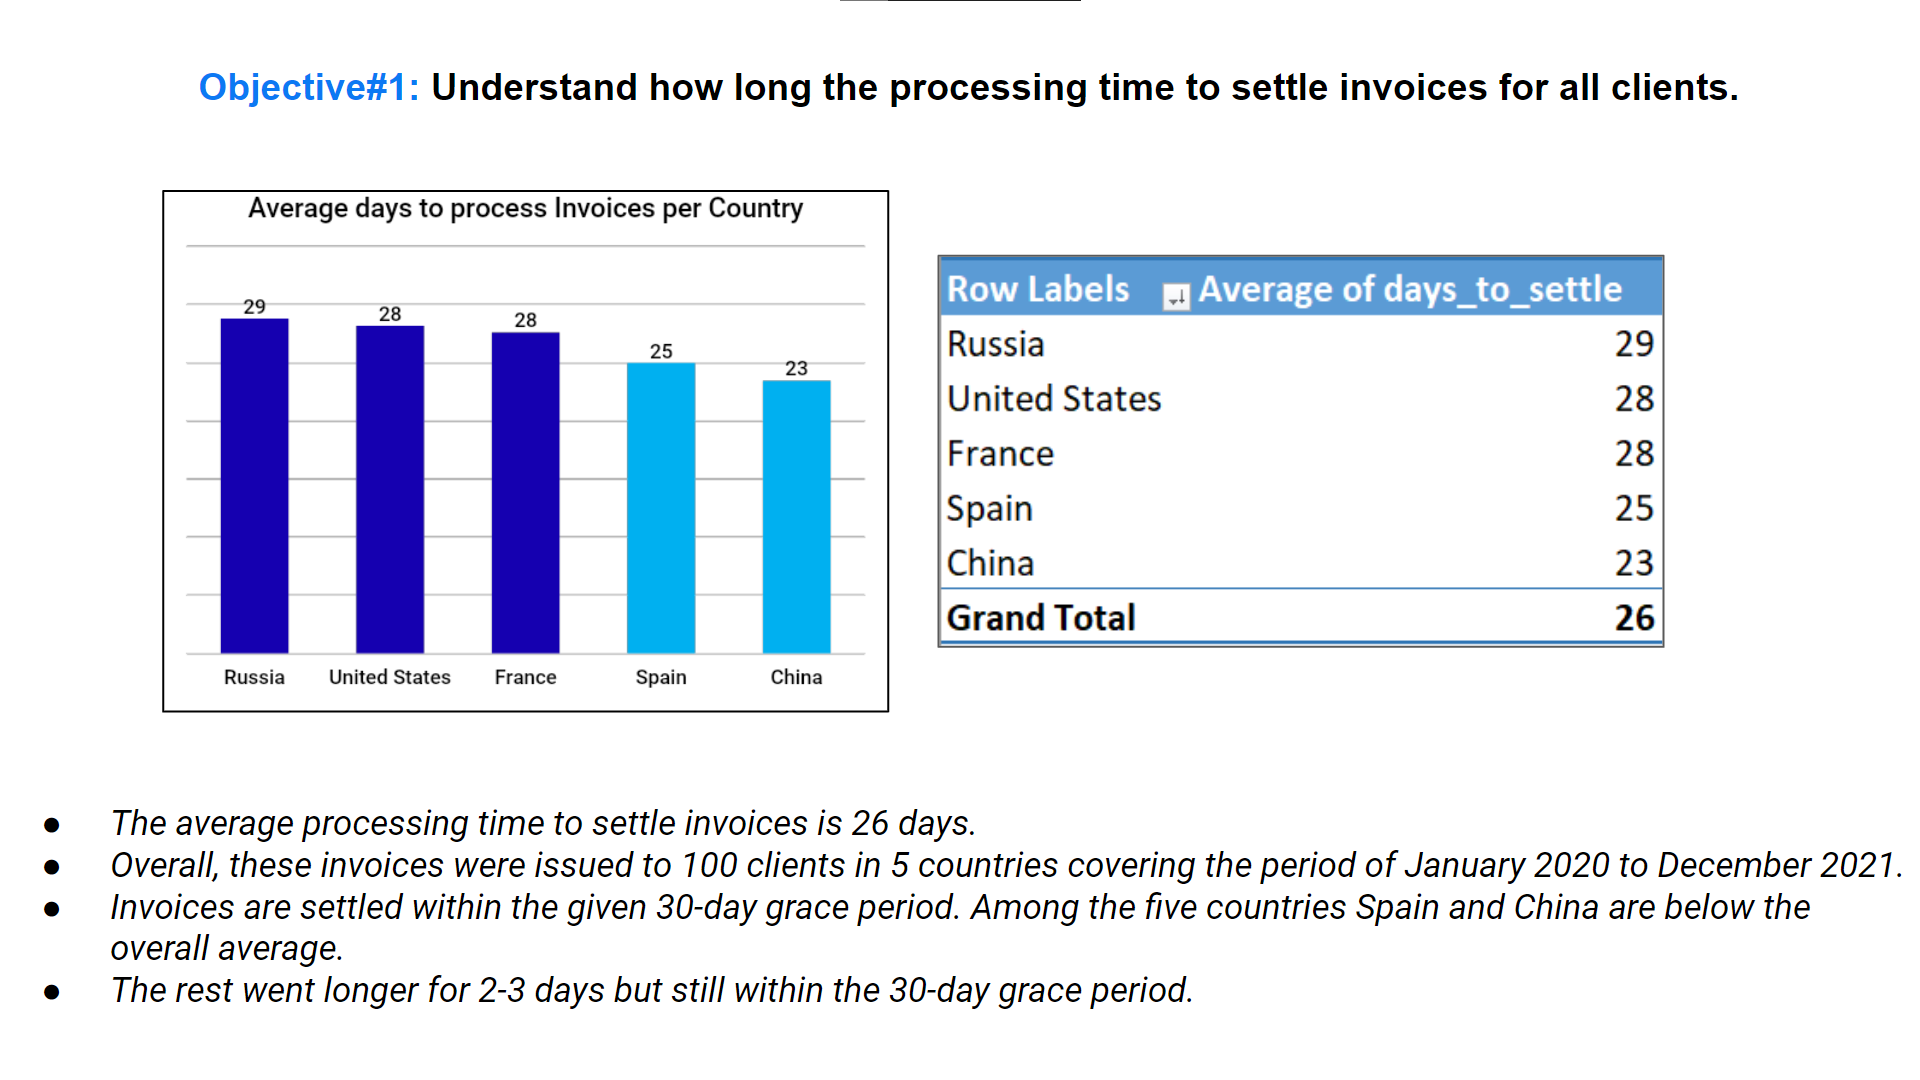
- What is the average processing time to settle invoices?
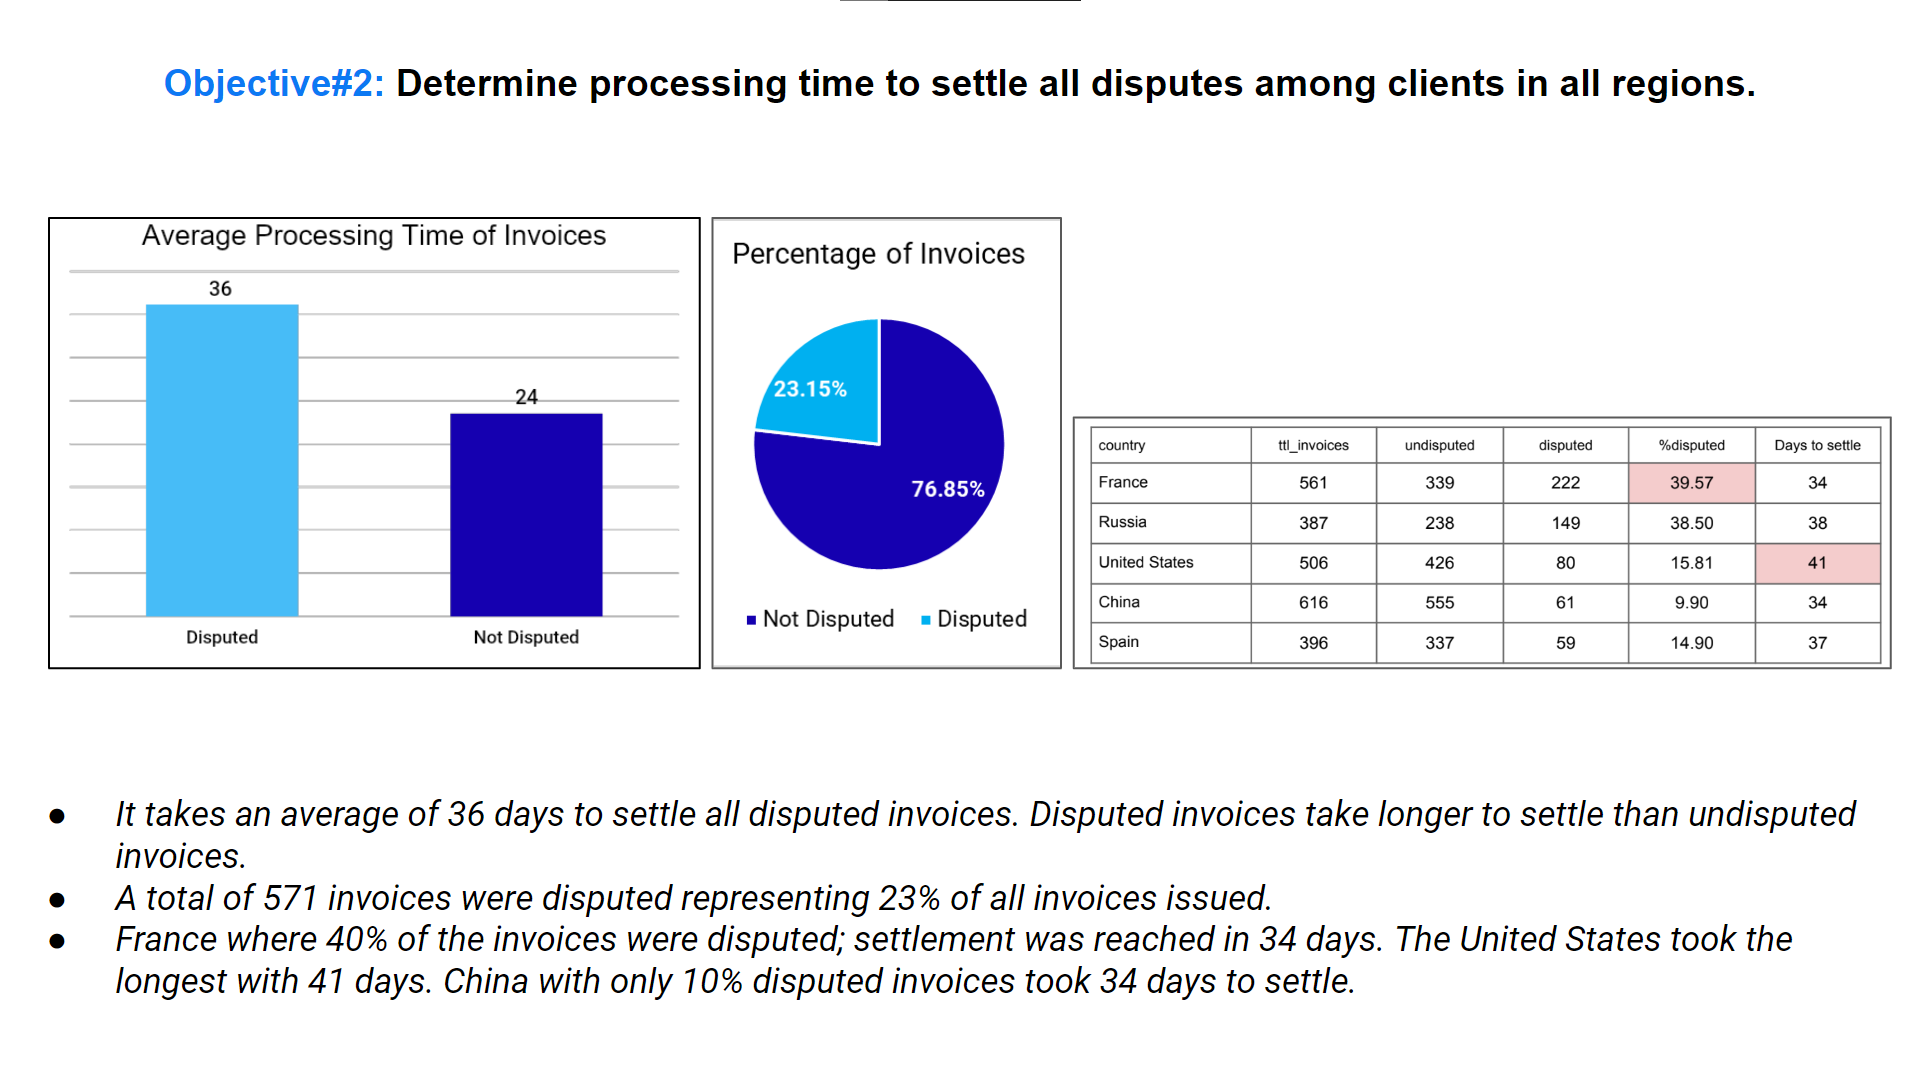
- What is the average processing time to settle disputed invoices?
- What is the percentage of disputes received by the company that were lost?
- What is the percentage of revenue lost by disputes?
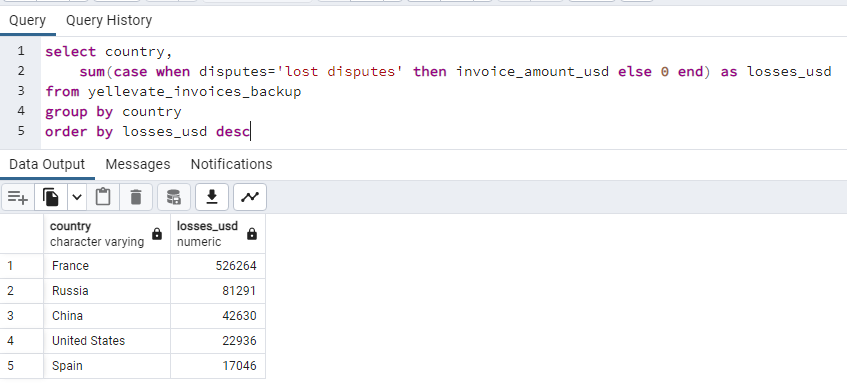
- Which country had the highest revenue losses from lost disputes?
Visualize
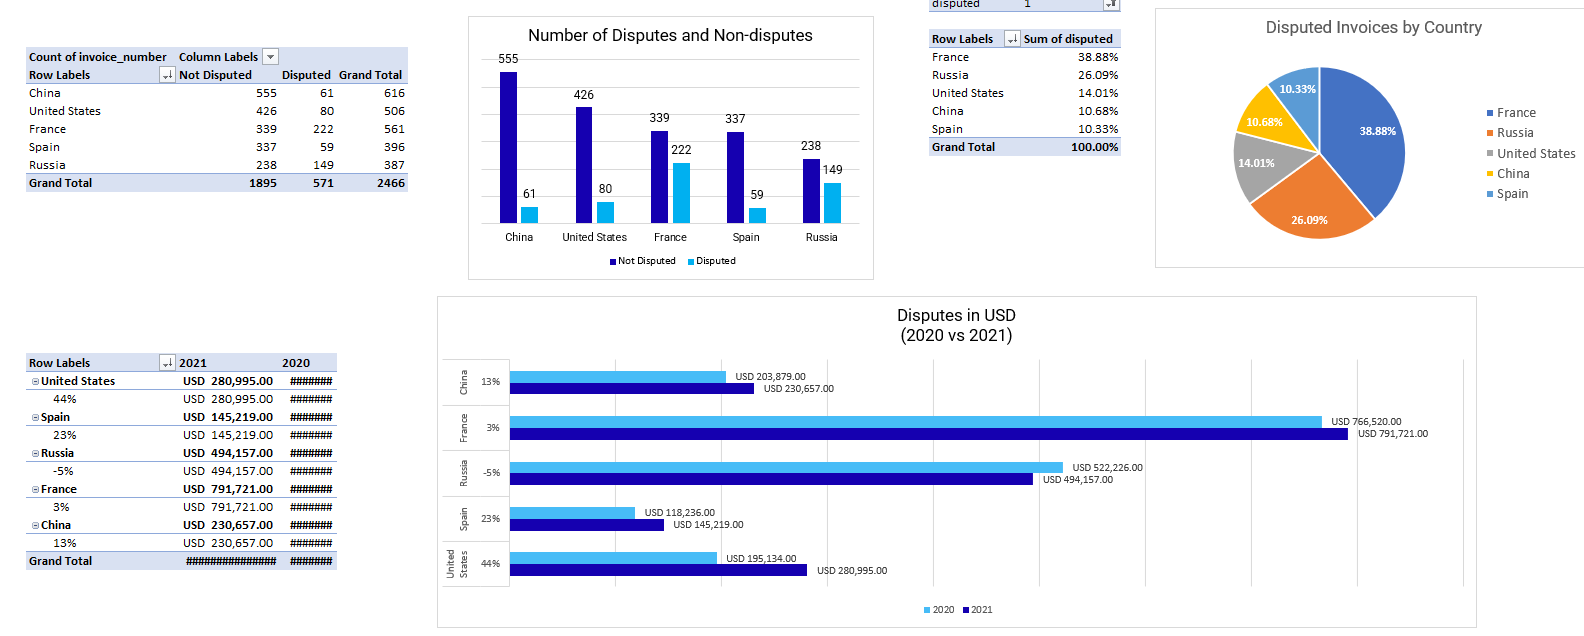
After opening the csv file through Excel, we saved the file as an Excel Workbook and proceeded in creating pivot tables and graphs. Below is a sample of our file.
Results
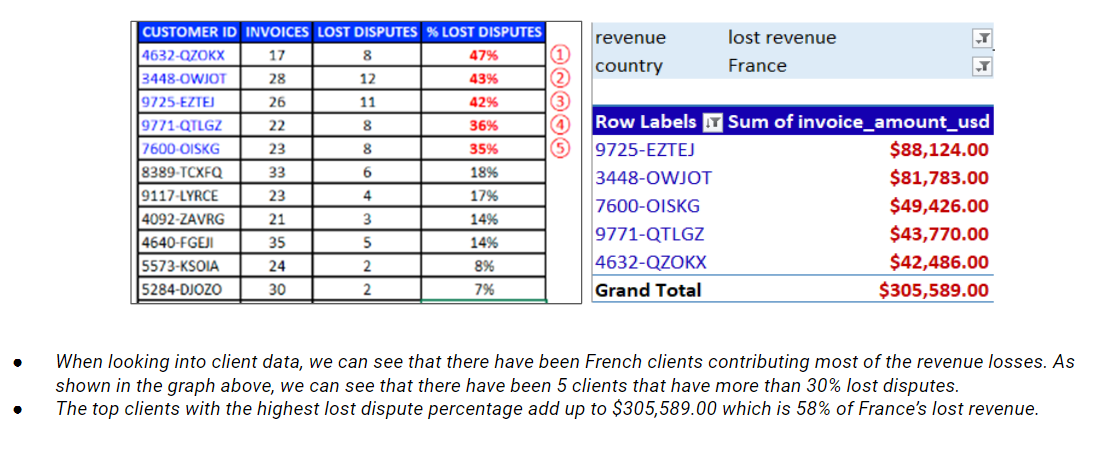
Insights
Additional Findings