Clockster HR Analytics
This is a Refocus Project that involves team effort to analyze HR data as requested by a stakeholder using tools, such as Excel, SQL, and Power BI. By the end of the case study, the group created an interactive dashboard and video presentation report to answer business questions.
Summary
The HR department of a medical company tasked a data analyst team with identifying the most disciplined and undisciplined employees and departments, analyzing the reasons for employee absence and tardiness, and determining which heads of departments tend to forgive employee lack of discipline. Inconsistent data formatting required pre-cleaning of CSV files in MS Excel before importing them into PostgreSQL. Data cleaning involved replacing empty values, unnesting arrays, and removing duplicates. Data was then imported into Power BI for further processing and analysis. Recommendations included implementing clearer tardiness and sanction policies, creating a reward system for punctual employees, and improving data gathering by adding more data points and undertaking further analysis to identify specific problem areas.

Background
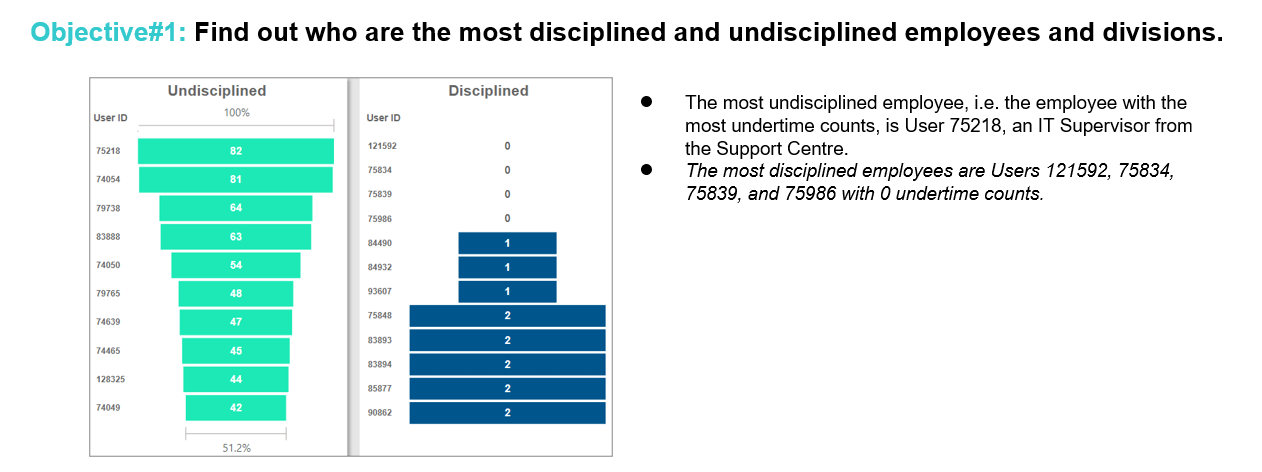
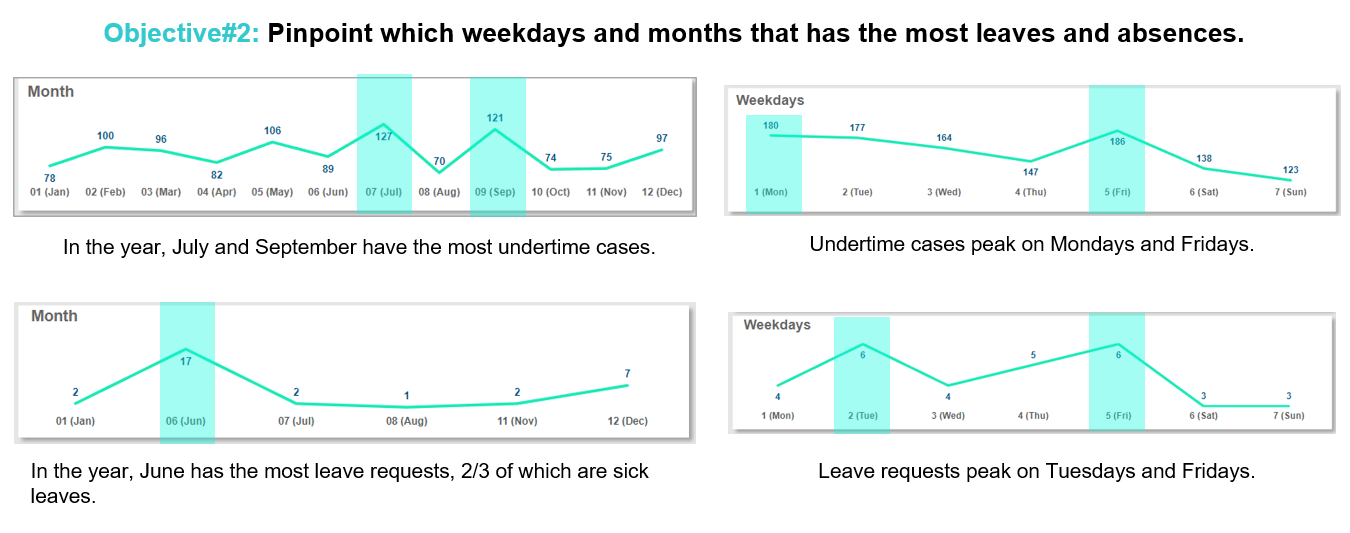
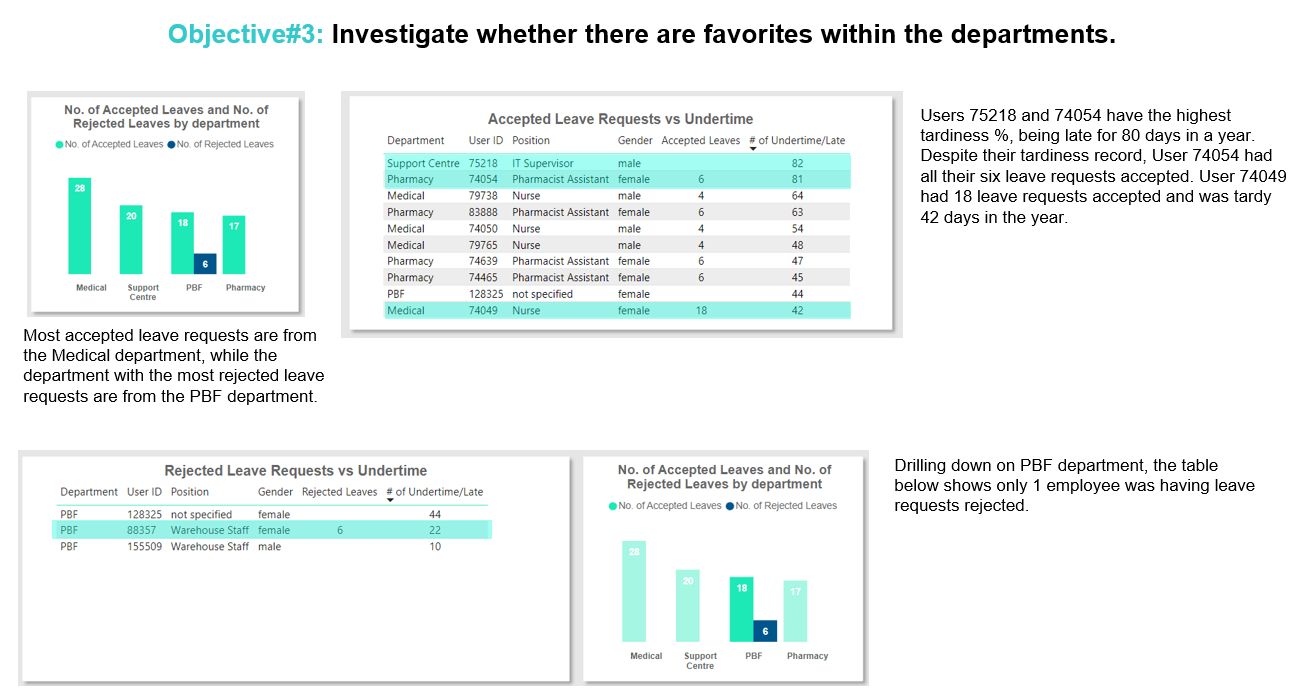
I was part of a data analyst team for the HR department in a medical company. The data provided by the HR department includes 10-15 parameters per day per year (arrival/departure time, vacations, sick days, time off, etc) on 1000+ employees of the company. The group needed to do the following tasks, which the CEO requested: identify the most disciplined and undisciplined employees and divisions, create a visualization with the analysis of weekdays and months when the most employees were late/absent (either for vacation or sick leave), and answer the following questions: Which heads of departments tend to forgive employees for lack of discipline? Are there any favorites for any heads of departments (perhaps some employees are always forgiven for being late, given time off, etc.)?
Objectives
The team had access to a dataset containing information on employee attendance, leave requests, payroll, schedules, and employee information. With this data, the group established team objectives for the analysis on employee attendance and leaves:
Methodology
Pre-Cleaning
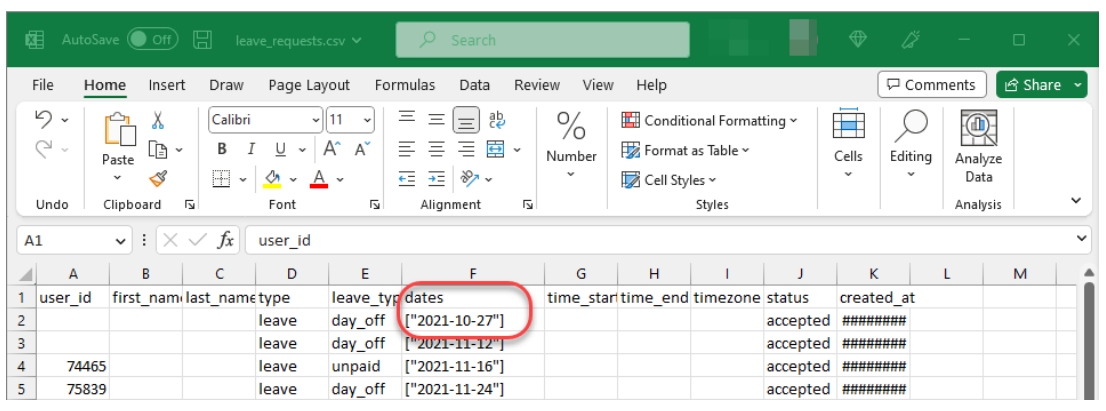
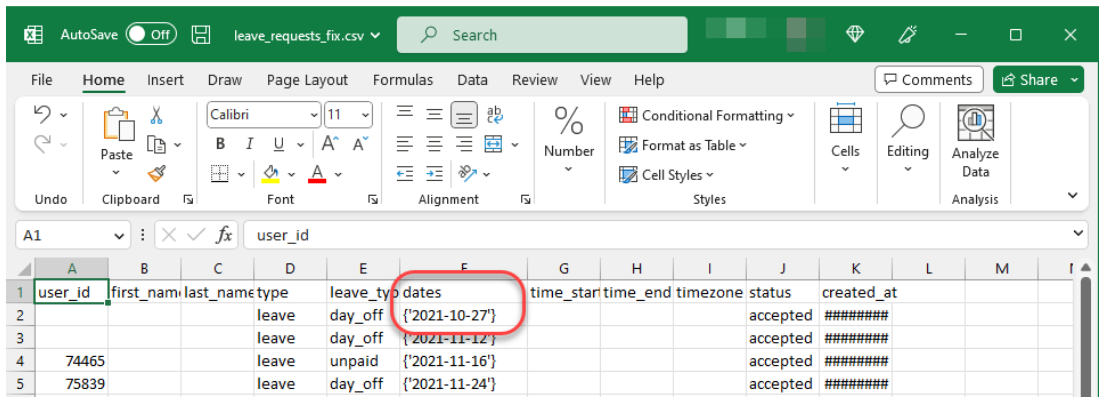
Upon inspection of dataset, it was noticed that some of these cannot be directly imported to PostgreSQL due to inconsistencies in data formatting, specifically the array within some of the columns. MS Excel was used to perform pre-cleaning of CSV files by changing array square brackets to curly braces.
Data Cleaning
After importing the dataset in PostgreSQL, each table were made a copy or backup in case errors or mistakes were to occur. The data was then cleaned by replacing empty values to with “not specified”, unnesting those with arrays, and removing duplicated rows.
As a sample, these are some of the SQL scripts for data cleaning. To view all scripts in detail you may visit this link: clockster_sql
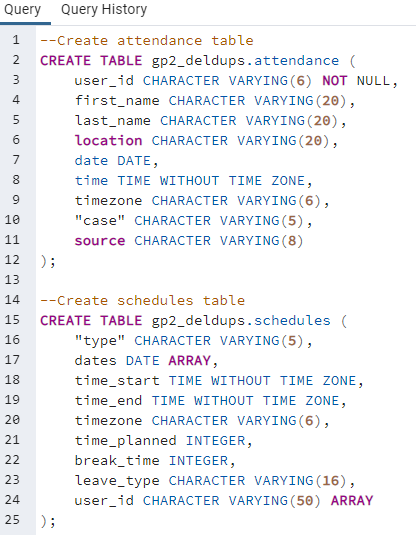
Importing data to PostgreSQL
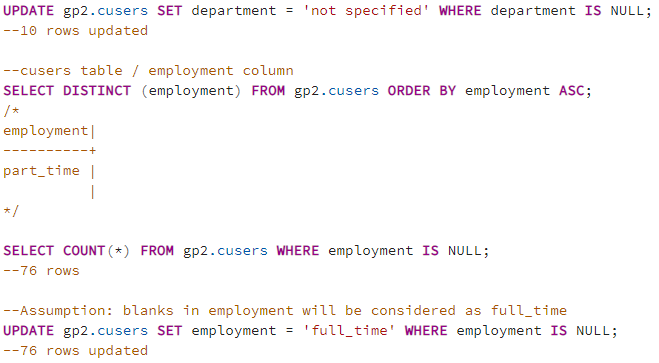
Changing null values
Analyze
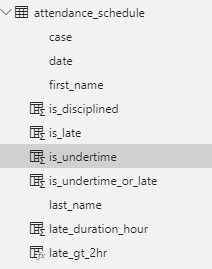
The datasets were imported into Power BI where further data processing was made, like merging attendance and schedule tables and removed outliers. Data analysis was initiated once calculations with DAX metrics (Add Column) were made. A dimenstion calendar table was also made with the use of MIN and MAX on attendance_schedule merged table.
Below are some DAX column measures:is_disciplined = IF([is_undertime_or_late] = 0, 1, 0)is_late = IF([case] = "IN", IF([undertime_duration_minute] > 10, 1, 0), 0)is_undertime = IF([case] = "OUT", IF([undertime_duration_minute] > 0, 1, 0), 0)late_duration_hour = IF([case] = "IN", DATEDIFF([schedules.time_start], [time], HOUR), 0)
Data Modeling
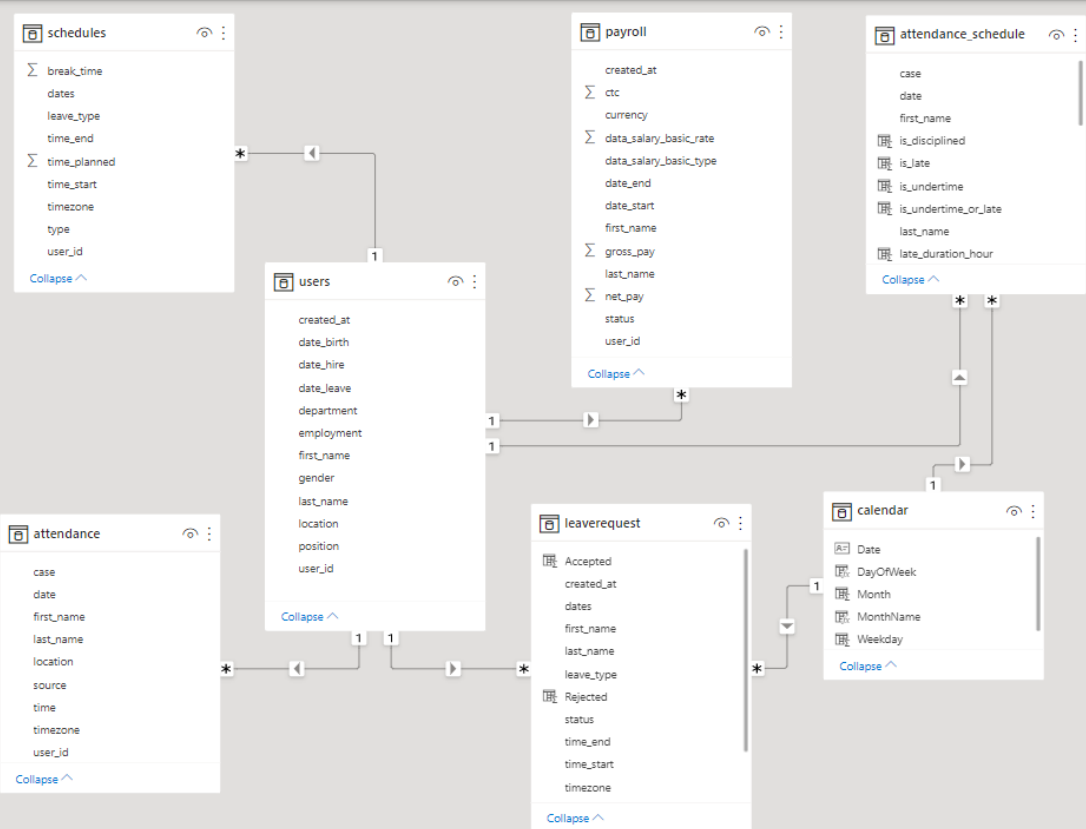
Below shows the data modeling schema I used, which is called a snowflake schema. I used Many-To-One for all entity-relationship diagrams (ERD).
Visualize
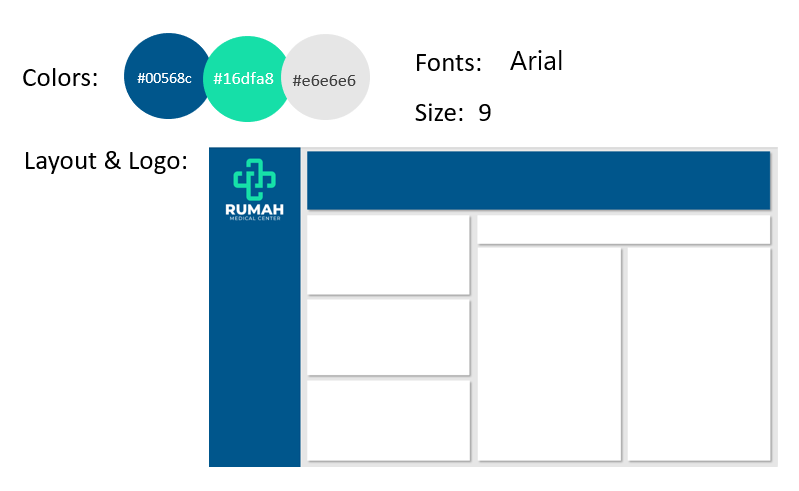
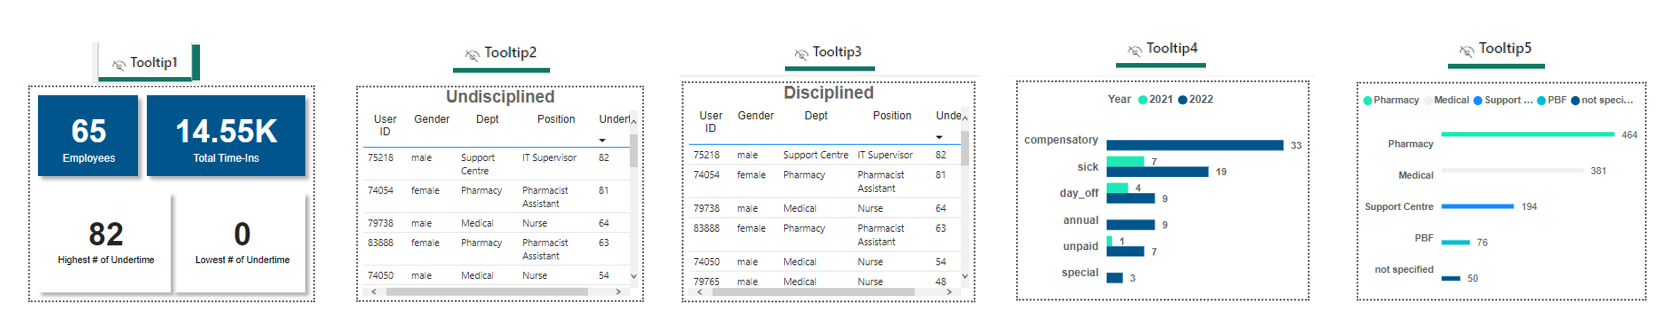
Below shows the layout we designed and tooltips for additional insights.
Results
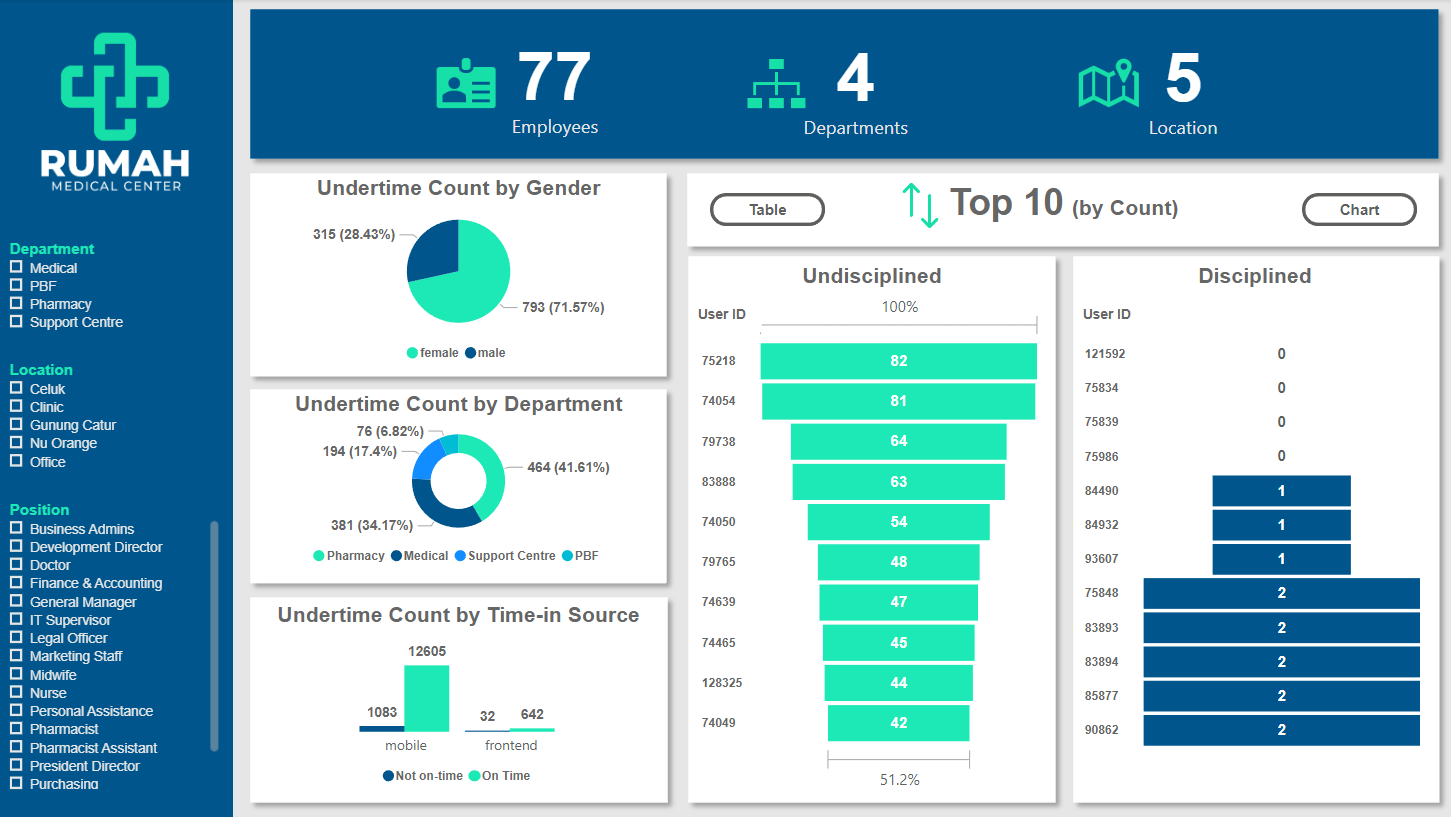
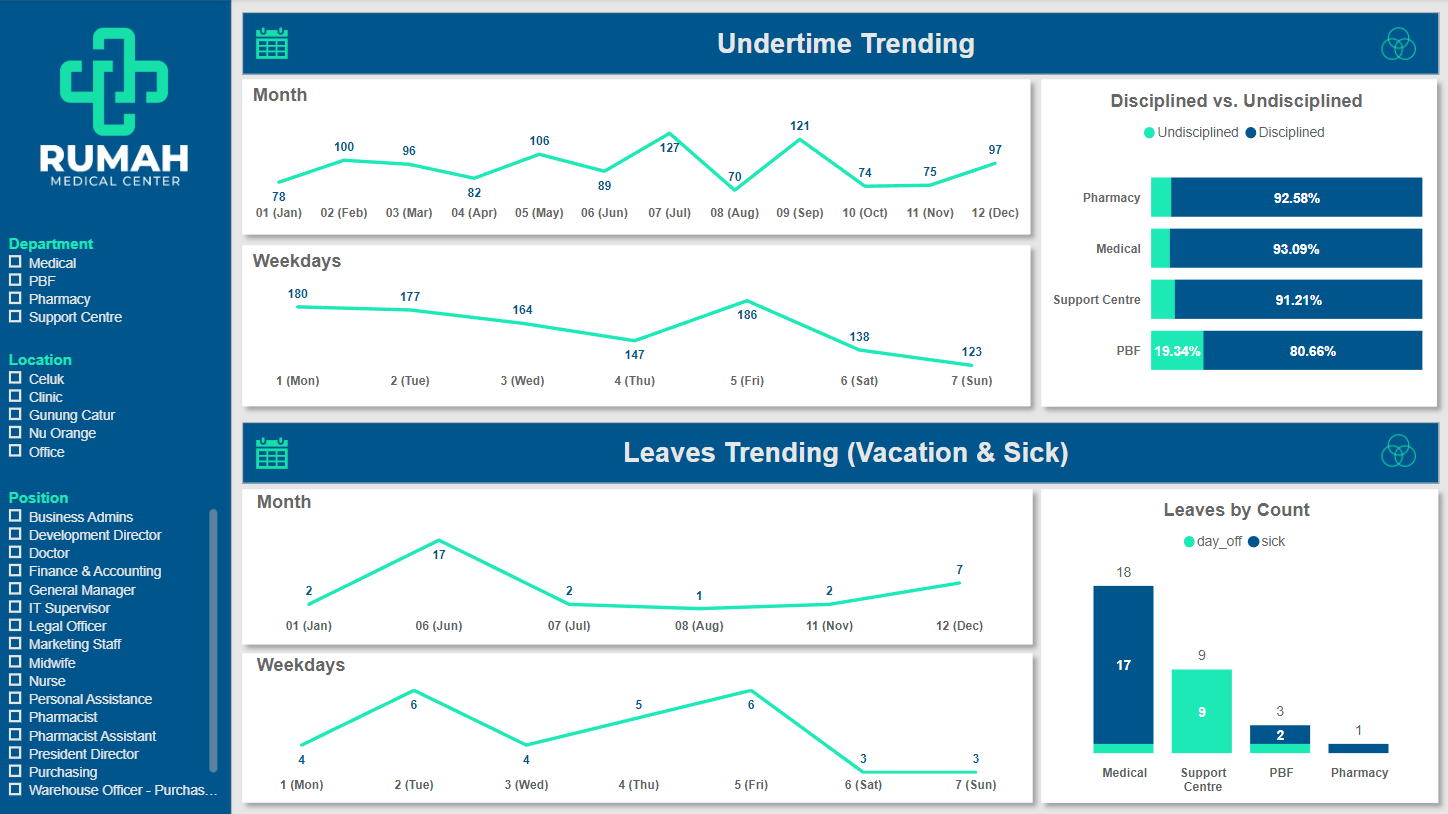
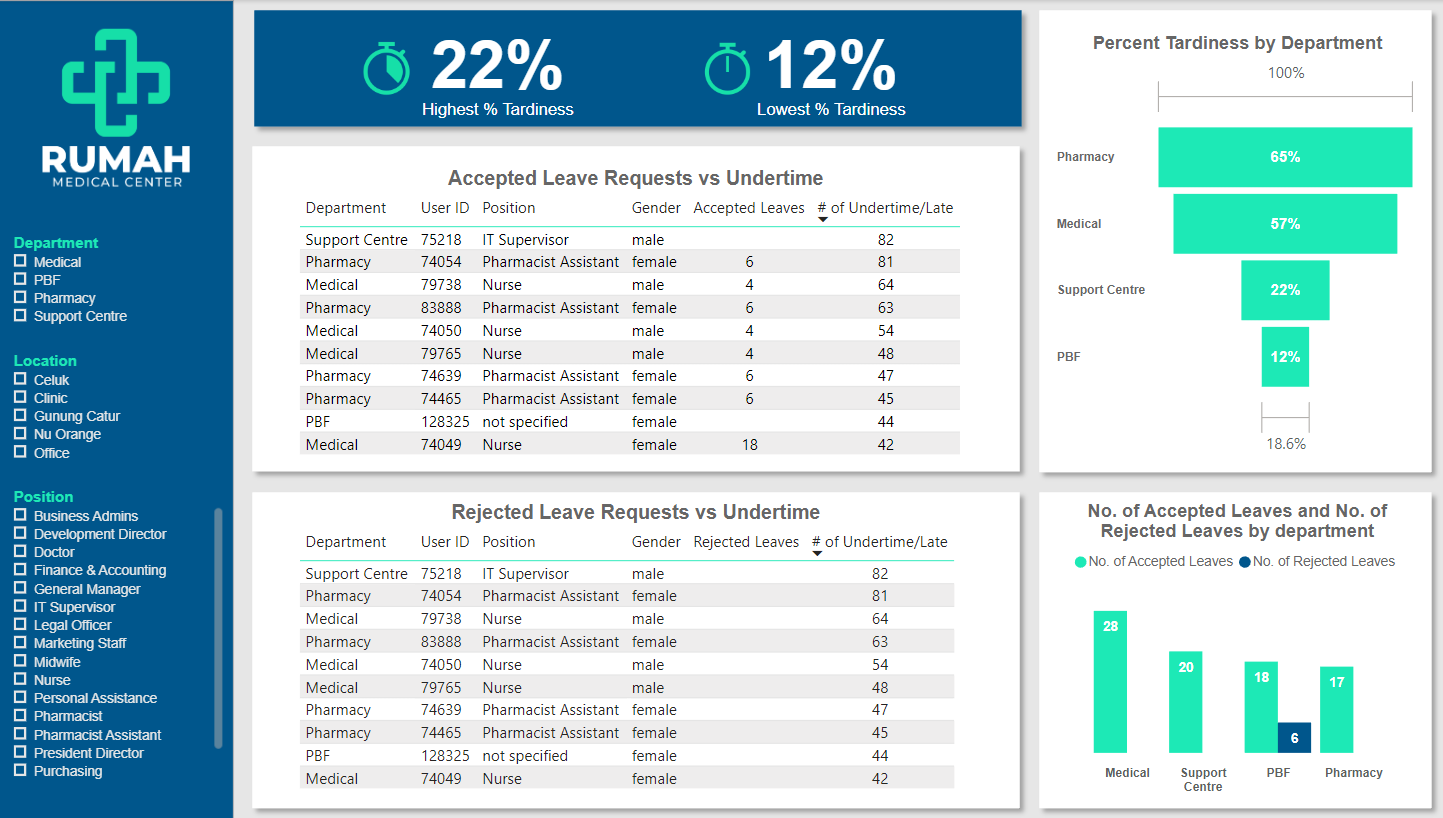
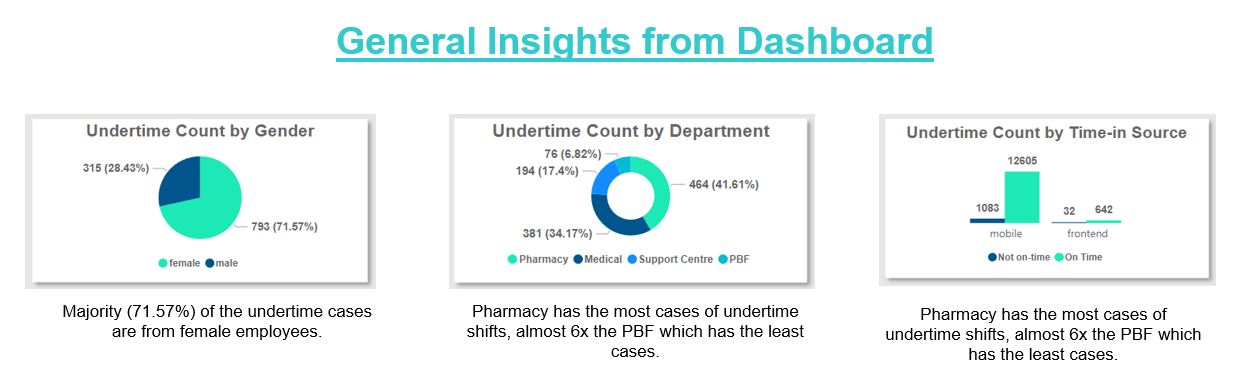
Insights
Note: The term “undertime” in this report means both late and undertime